

On the Home page you will also find other useful software for a simple and economical management of your business.
A SIMPLE METHOD FOR THE ECONOMIC MANAGEMENT OF PRODUCTION COMPANIES
The software was designed specifically for manufacturing SME management control and allows you to build a structured cost center budget in Excel at a professional level.
Specification of the types of software:
Software for the management of 56 Production Centers = manages 3 production departments with 10 Production Centers each; 3 production departments with 6 Production Centers each; 1 packaging department with 3 Production Centers for automatic packaging and 3 Production Centers for automatic packaging; 1 department for manual packaging and for manual packaging.
Software for the management of 71 Production Centers = manages 3 production departments with 15 Production Centers each; 3 production departments with 6 Production Centers each; 1 packaging department with 3 Production Centers for automatic packaging and 3 Production Centers for automatic packaging; 1 department for manual packaging and for manual packaging.
Software for the management of 101 Production Centers = manages 3 production departments with 25 Production Centers each; 3 production departments with 6 Production Centers each; 1 packing department with 3 Automatic packing Production Centers and 3 Automatic packing Production Centers; 1 Manual packing department and Manual packing department.
The following images only partially illustrate the operation of the software.
THE SALES BUDGET
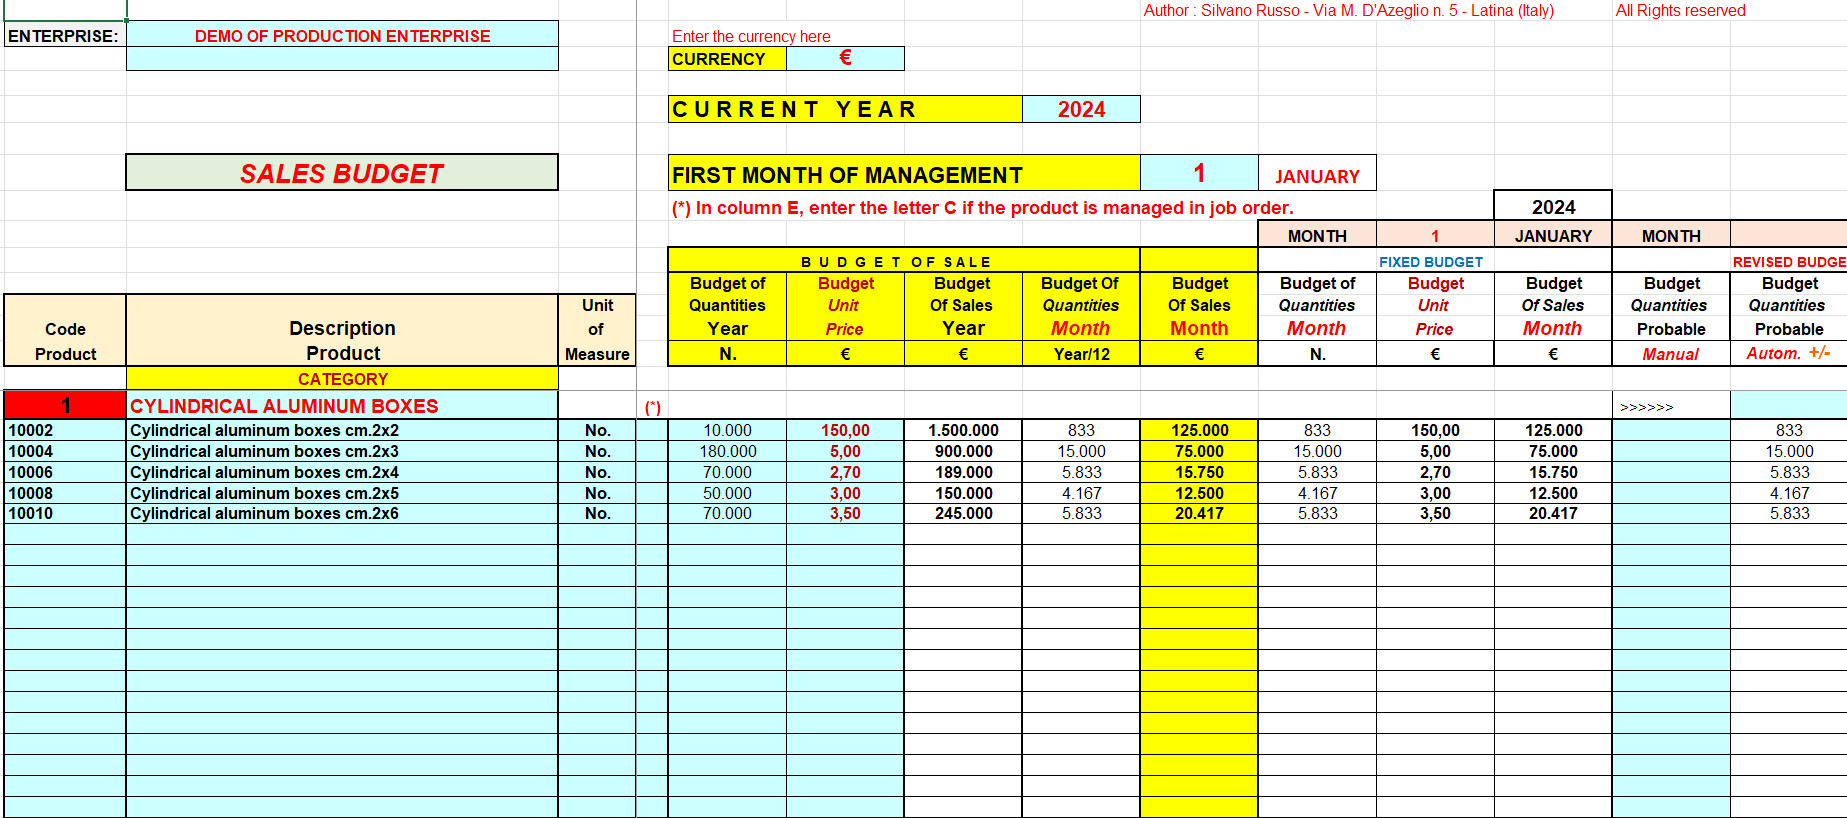
The sales budget is derived from the sales forecast. It shows the expected sales and the related revenues. In the image above, the budget is drawn up monthly and contains the summary of sales and the objectives to be achieved. To draw up this budget, it is necessary to carry out market analysis, analysis of historical trends, and an analysis of internal information such as sales development, customer data, orders received and more. It is drawn up in a dynamic and flexible way with the possibility, for the company, of more easily identify the sales objectives to be achieved.
THE LIST OF PROCESSING PHASES
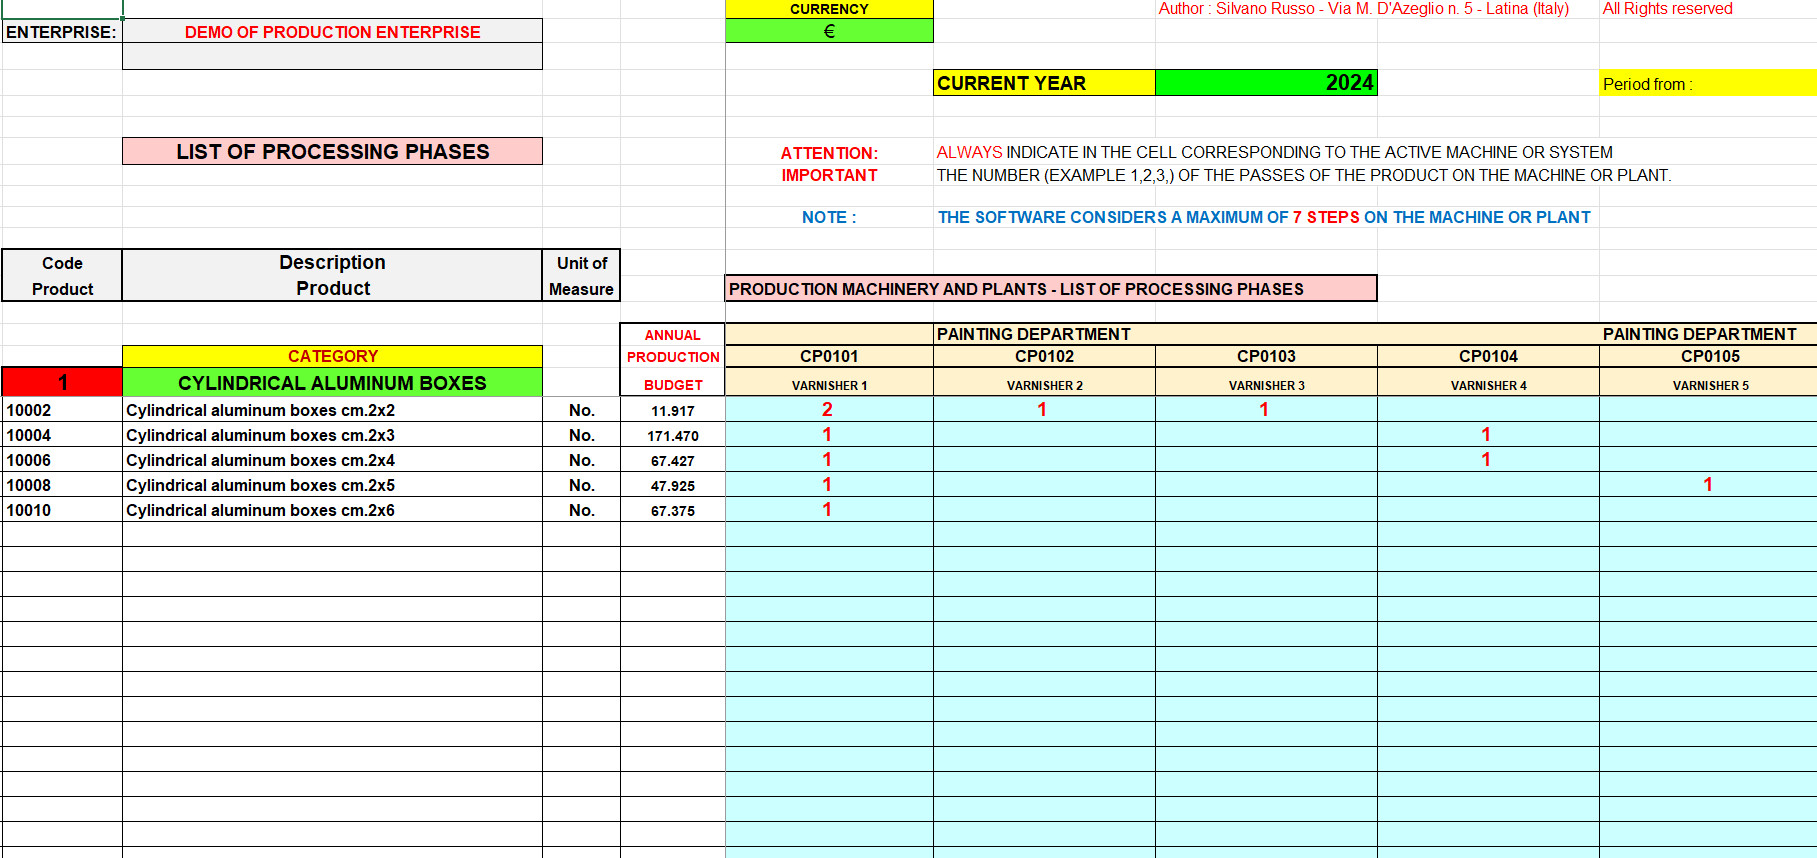
The processing phases, in a processing cycle, are an ordered and rational succession of activities necessary to transform one or more raw materials into a semi-finished or finished product. In this case the image shows the possible processing steps that a product can undergo and, therefore, for each product, the standard production path.
Of course, in the final analysis, and with the adequate equipment of the machines or systems, the products can undergo processing processes other than the standard ones.
THE UNIT COST SHEET OF THE PRODUCT
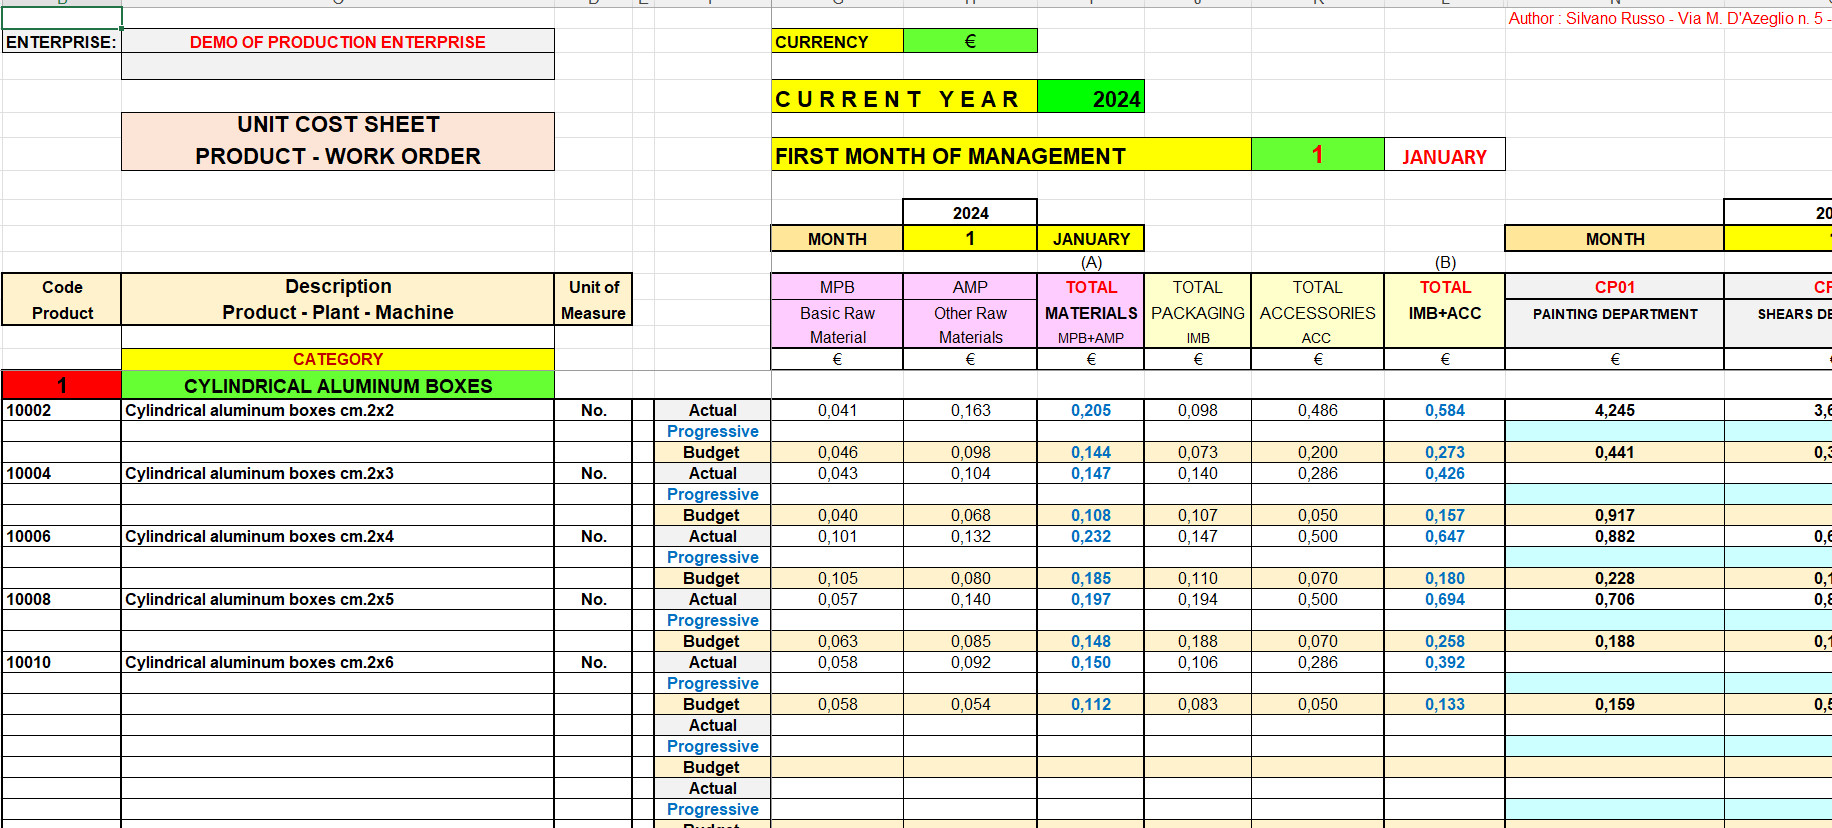
The unit cost sheet specifies the segmentation of costs that include the cost of sales of a produced item. For example, the information on the cost of sales of an item can be segmented into material, transformation costs, sales costs, etc.The image produced also highlights, for example, the cost of Semi-finished products (SML) used by finished products. The unit cost sheet of semi-finished products is managed separately.
Every reference to finished products also applies to all products managed in the order.
We are able to manage the cost sheets for both productions on order and for productions in stock or both at the same time.
THE BUDGET AND THE FINAL COSTS OF THE PRODUCTION COST CENTERS
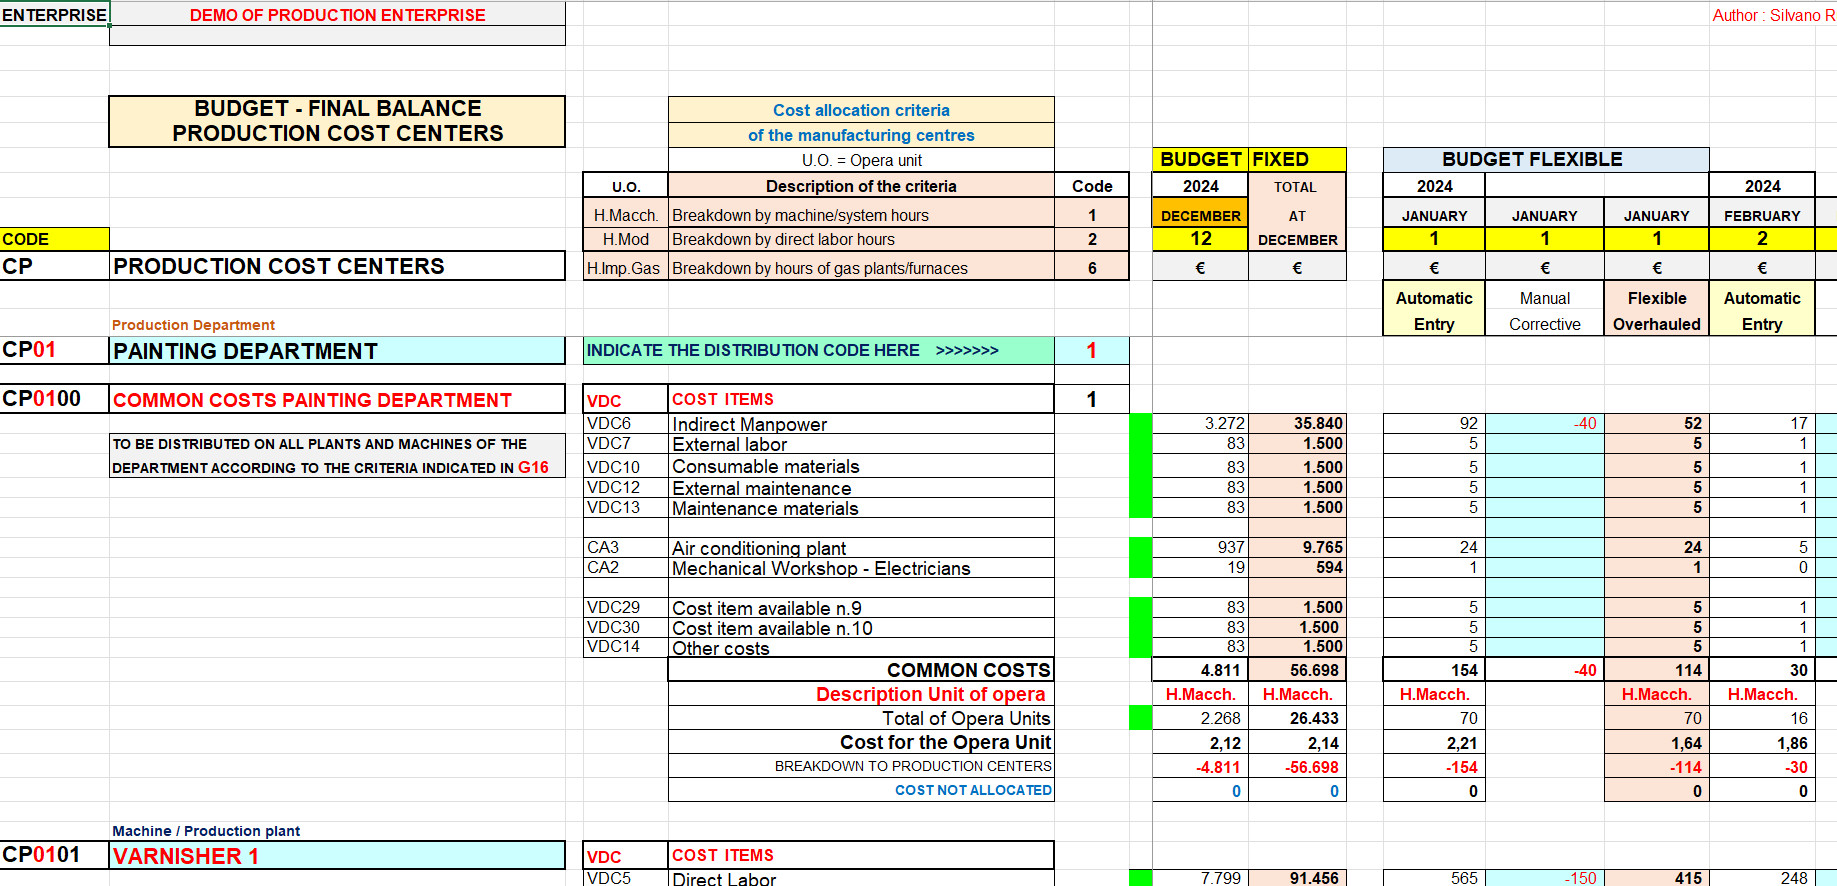
Cost centers are accounting units of the company in which costs are aggregated. Each department of a company has an organizational structure that allows it to be divided into areas in which costs arise that can be detected separately.
The image shows the costs of a production department, for example, the painting department. These costs are distributed to the individual production centers of the department (Varnishing machine no. 1; Varnishing machine no. 2 etc.) on the basis of their respective production activities.
The image also shows a partial structure of the Flexible Budget. The Flexible Budget is essential for monitoring the efficiency of the production centers and is closely linked to the activity levels of a company by assuming different values of the production rate.
At period end, actual data entry automatically generates budget variance analysis for every cost center and expense line.
THE BUDGET AND THE FINAL STATEMENT OF TRANSFORMATION COSTS
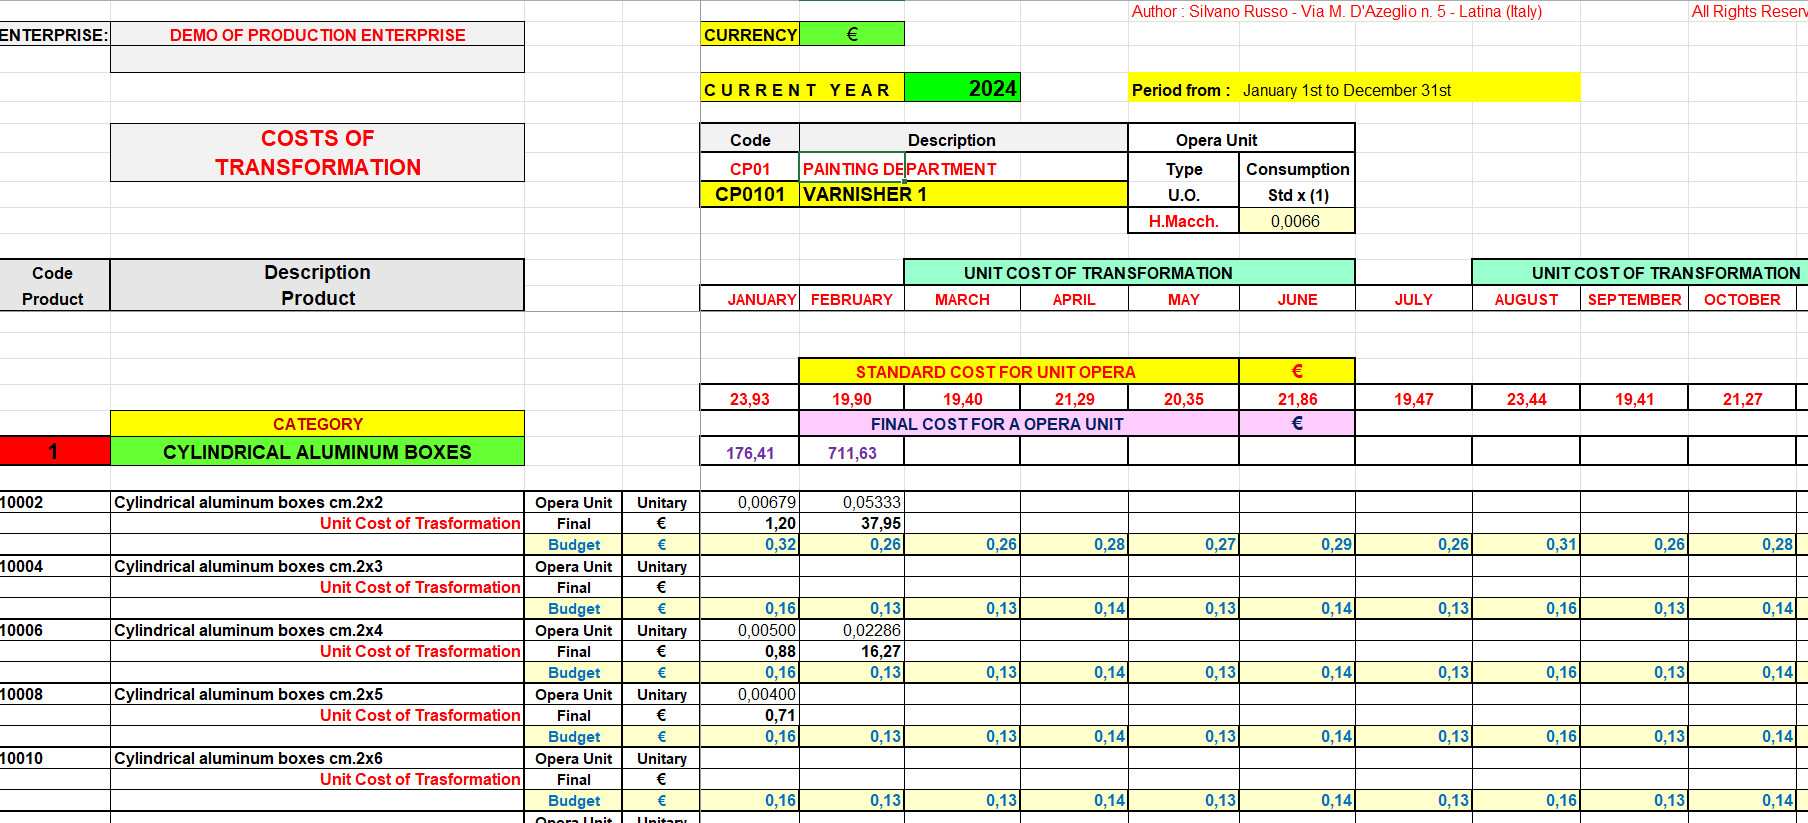
The image highlights the unit labor consumption, the actual cost and the standard unit processing cost of each item within the category to which it belongs.
We can monitor 6 production departments, 1 packaging department and 1 packaging department.
THE BUDGET OF INCOME STATEMENT AND THE FINAL INCOME STATEMENT
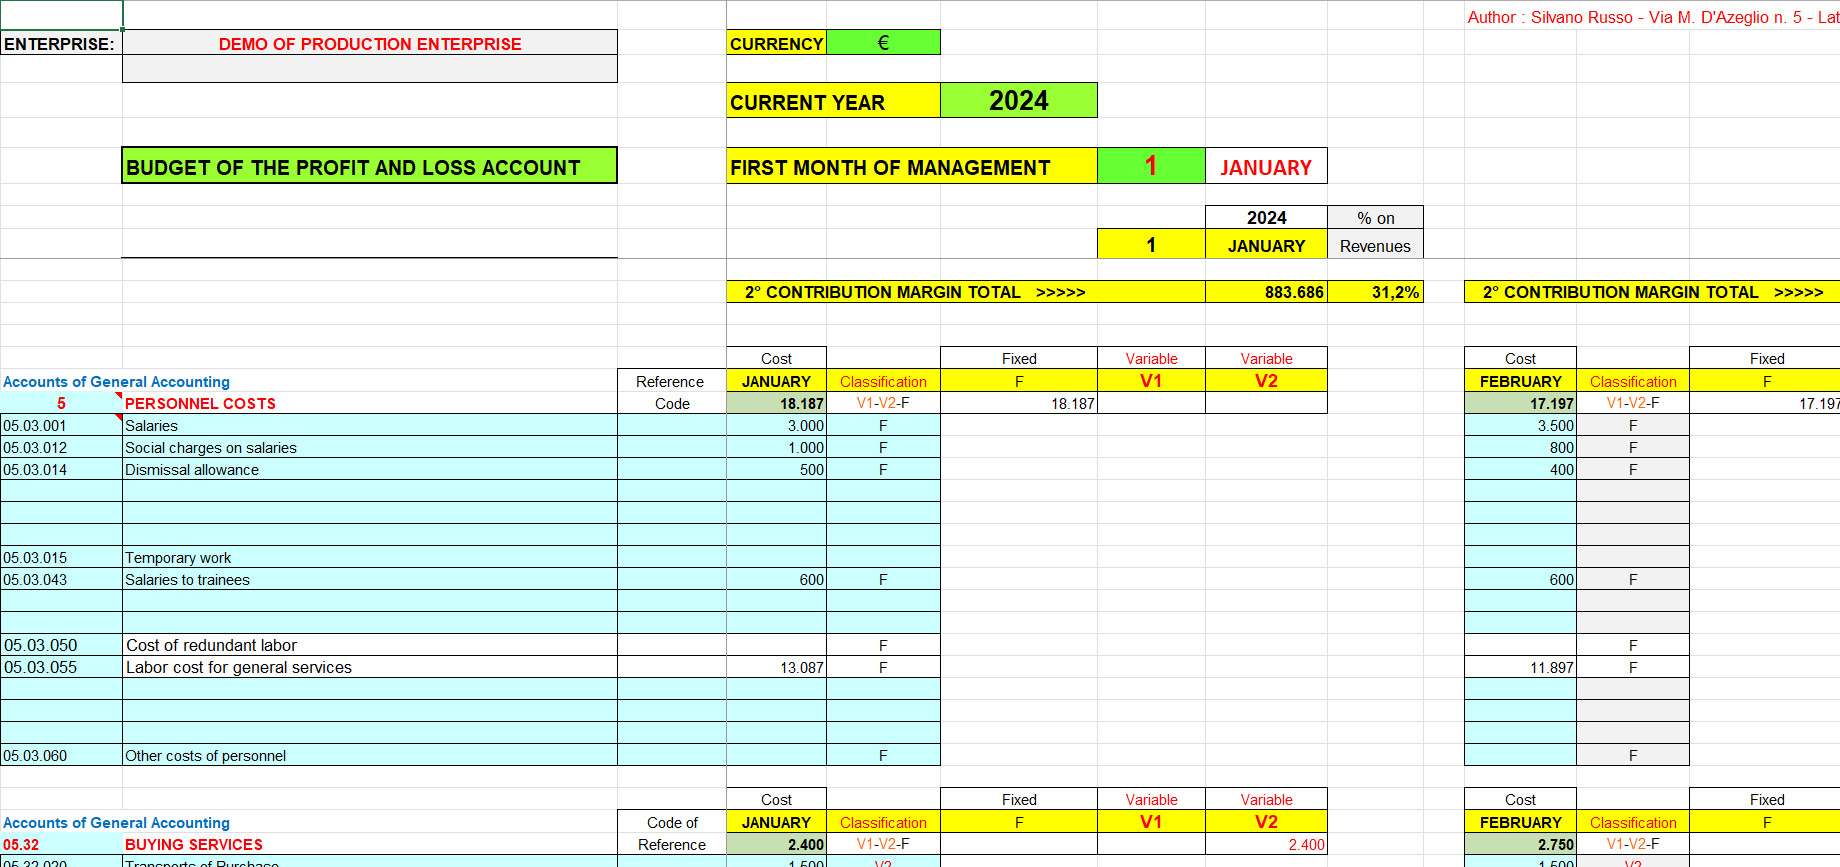
The image highlights the structure, only partial, of the income statement of the production company.
Naturally, the structure of the income statement starts from the total and periodic contribution margins of all product categories. We can monitor 10 product categories and for each category 50 finished products.
But, among the various categories, we could also manage those reserved for production on order and, therefore, for the production of machinery or particular systems requested on specific production orders.
As you can see, we can manage production companies even in their production diversification and constantly monitor their margins as a fundamental lever for their survival.
PROSPECTUS OF ANALYSIS OF VARIATIONS
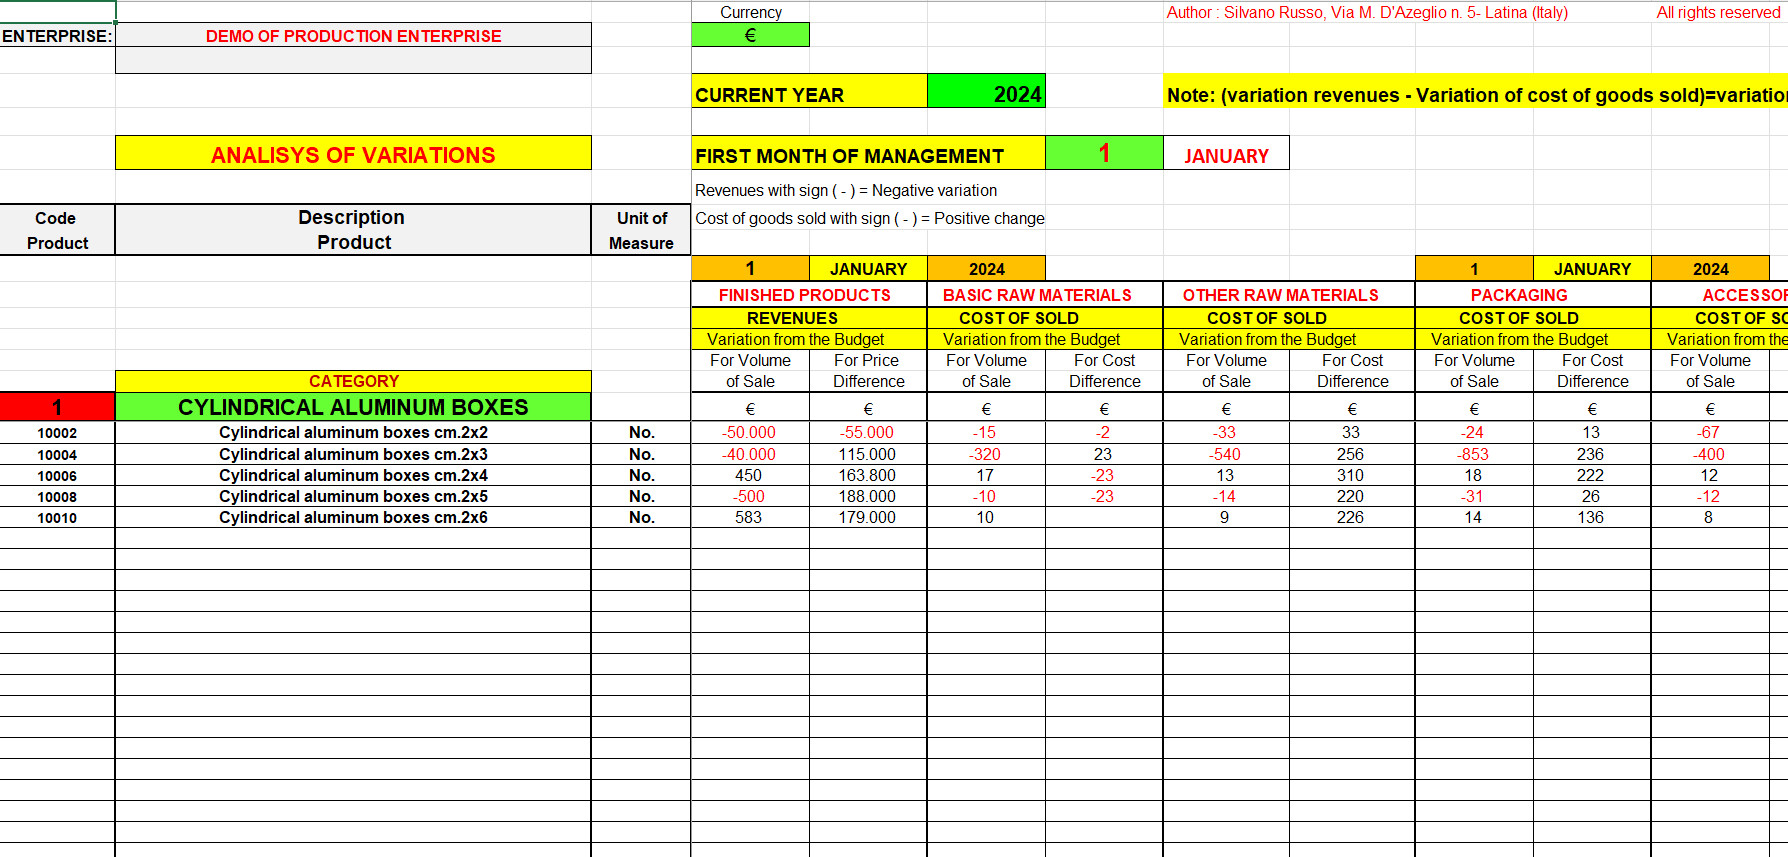
The image shows the variations from the budget or rather the verification of the degree of achievement of the pre-established objectives. It therefore compares the budget with the actual results of the management.
The analysis of the variations from the budget is an integral part of the control of the company management and allows to obtain a precise and accurate evaluation of the income elements that present a lack of correspondence with the planned objectives.
It allows to relate the planned data, estimated in the budget stage, with the actual ones, asking questions and, therefore, providing solutions on the main causes that have reported higher costs or achieved lower revenues. The analysis of the deviations from the budget is an indispensable tool for the company. In the illustrated table, the deviation from the budget of the cost of materials is represented in a synthetic manner. The cost of materials can be analyzed further in detail in its component of variation of the exchange rate of the purchase currency, of the consumption of the material and of the purchase price.
SUMMARY PROSPECTUS
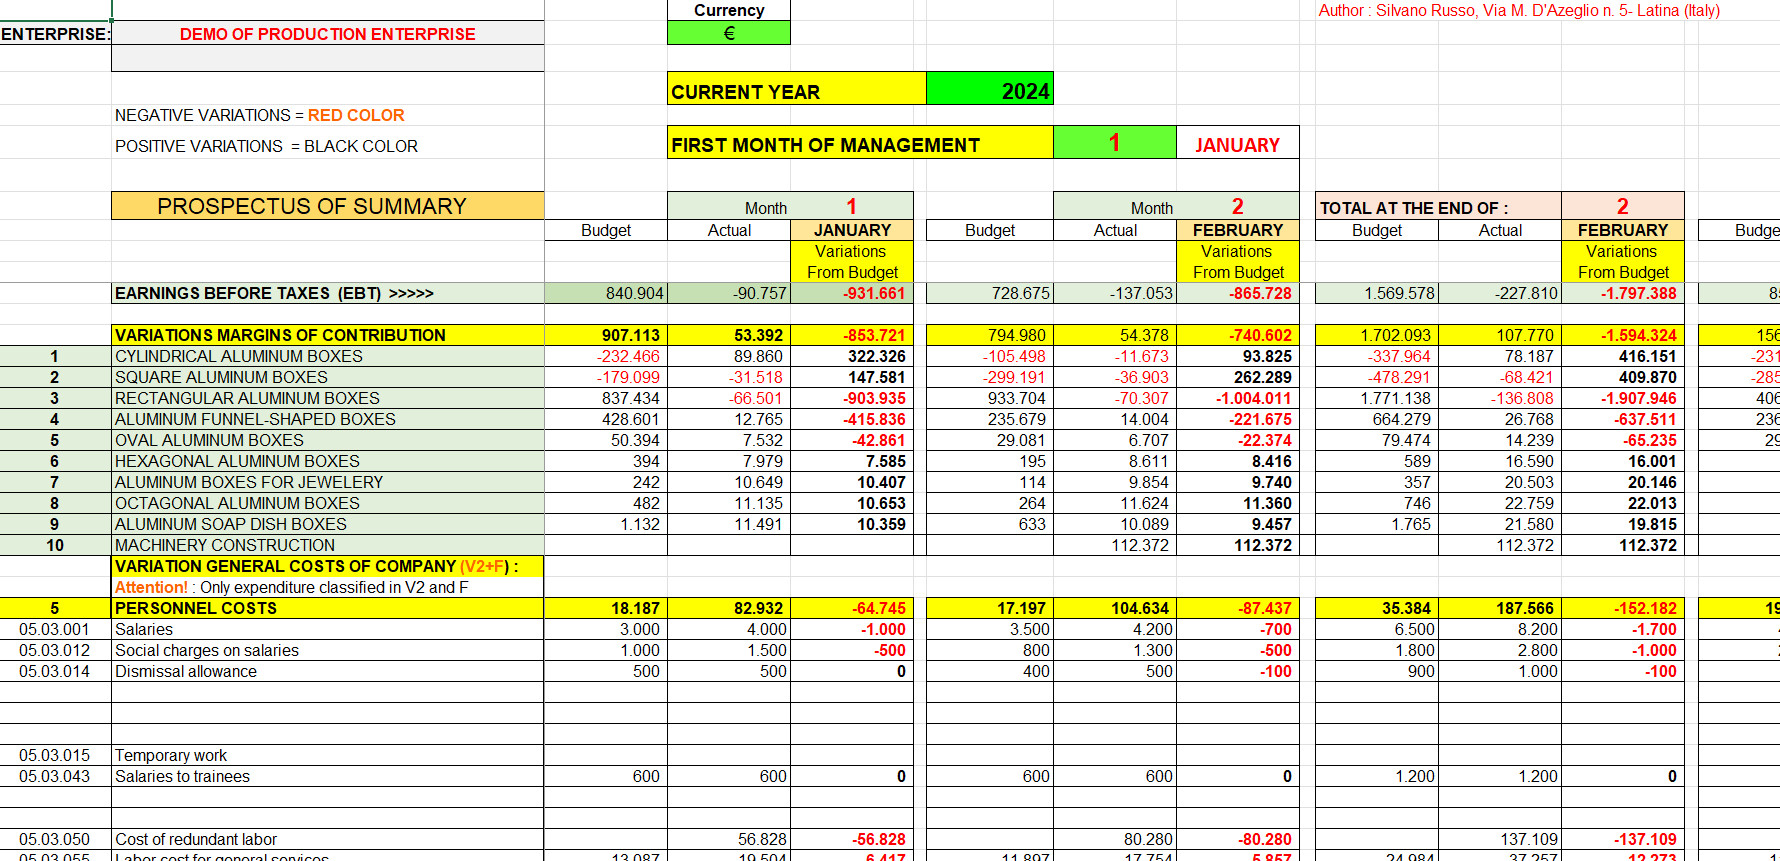
This is a partial image of the economic synthesis of a production company.
All the positive and negative elements of income are compared, by homogeneous categories, and the squaring of planned objectives and achieved objectives is achieved by passing through all the phases of the transformation.


Reviews
There are no reviews yet.