

On the Home page you will also find other useful software for easy and economical management of your business.
A SOFTWARE SIMPLE AND USEFUL FOR THE MANAGEMENT OF THE COMMERCIAL ENTERPRISE
This software permit commercial enterprise management control Excel
In the site is shown a template to use for the economic management of a commercial enterprise up to 2,000 articles. This illustration also applies to software that manages the economic situation of commercial enterprises up to 4000 and up to 6000 articles.
The file “Economic management of the commercial enterprise ” was designed to manage in a simple way the economic budget and the consumptive Economic of a commercial company starting from the detection of the contribution margin for each article and for each category of articles.
Then, are determined the contribution margins standards of all articles and are detected the actual margins of contribution. From their comparison are put in evidence all deviations from the budget.
In particular, the deviations from the budget can be summarized as follows:
– deviations for variation of prices of sale;
– deviations for variation of sales volumes;
– deviations for the change in the cost of the items constituting the contribution margins;
– deviations for variation of the volumes of the costs of the items constituting the contribution margin due to the variation of sales volumes.
The software provides management, alternative, of two periods of business. A period that goes from 1 January to 31 December, in this case is inserted 1 as the first month of economic management, and a period that goes from 1 July to 30 June of the following year,in this case is inserted 7 as the first month of corporate management.
The software provides for the management of 20 categories of articles for each of which are provided 100 articles. So in total 2,000 articles.
The software shown is dynamic, flexible and easy to use.
The images below are purely indicative and do not represent, in an exhaustive way, the entire operation of the software.
Image no. 1 – The budget of sale
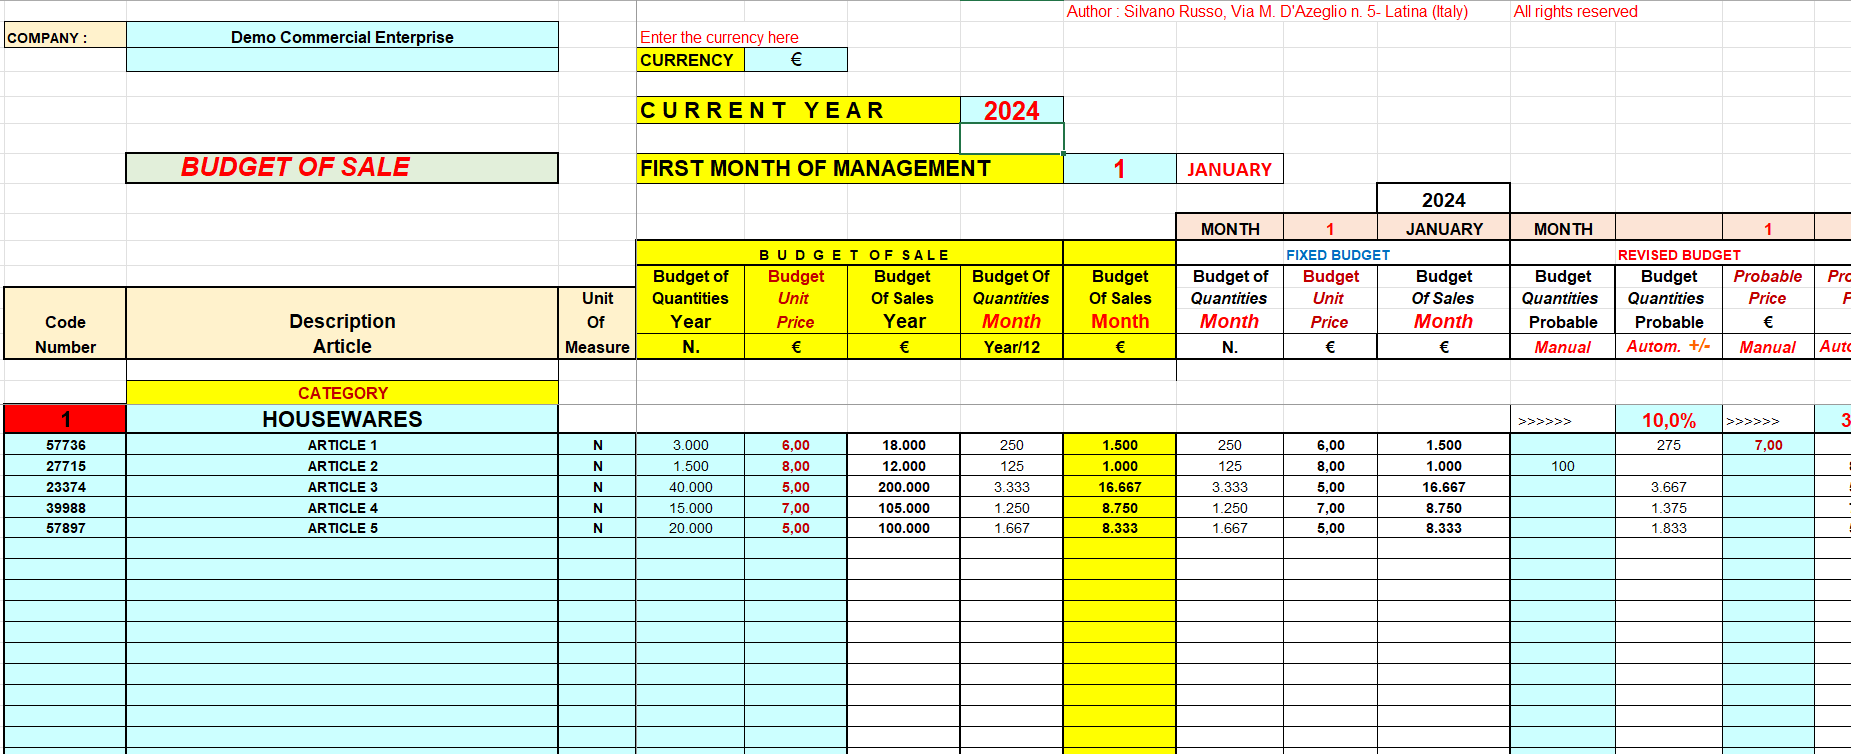
Retail business budget software.
All of the worksheets in this software depend, prevalently, from the flowsheet of sales budgets. For example, the data related to the currency, the year of competence, the first month of management ,the codes of the articles, the description of the articles etc., once inserted in the budget of sale, they will be repeated in all the other sheets of the software.
The user of the software may modify the budget fixed by inserting in the columns of the Revised Budget new data on the quantities to be sale and on the unit sale price. The budget of sale will be, therefore, definitive after identified through the variations indicated in the Revised Budget, the goal of selling more adequate.
The changes to make in the Revised Budget may be carried out both in a manual manner that in an automatic manner. The two methods can coexist within the same category. Of course the manual variation of the data prevails on that automatic.
Image no. 2 – The budget of the direct costs
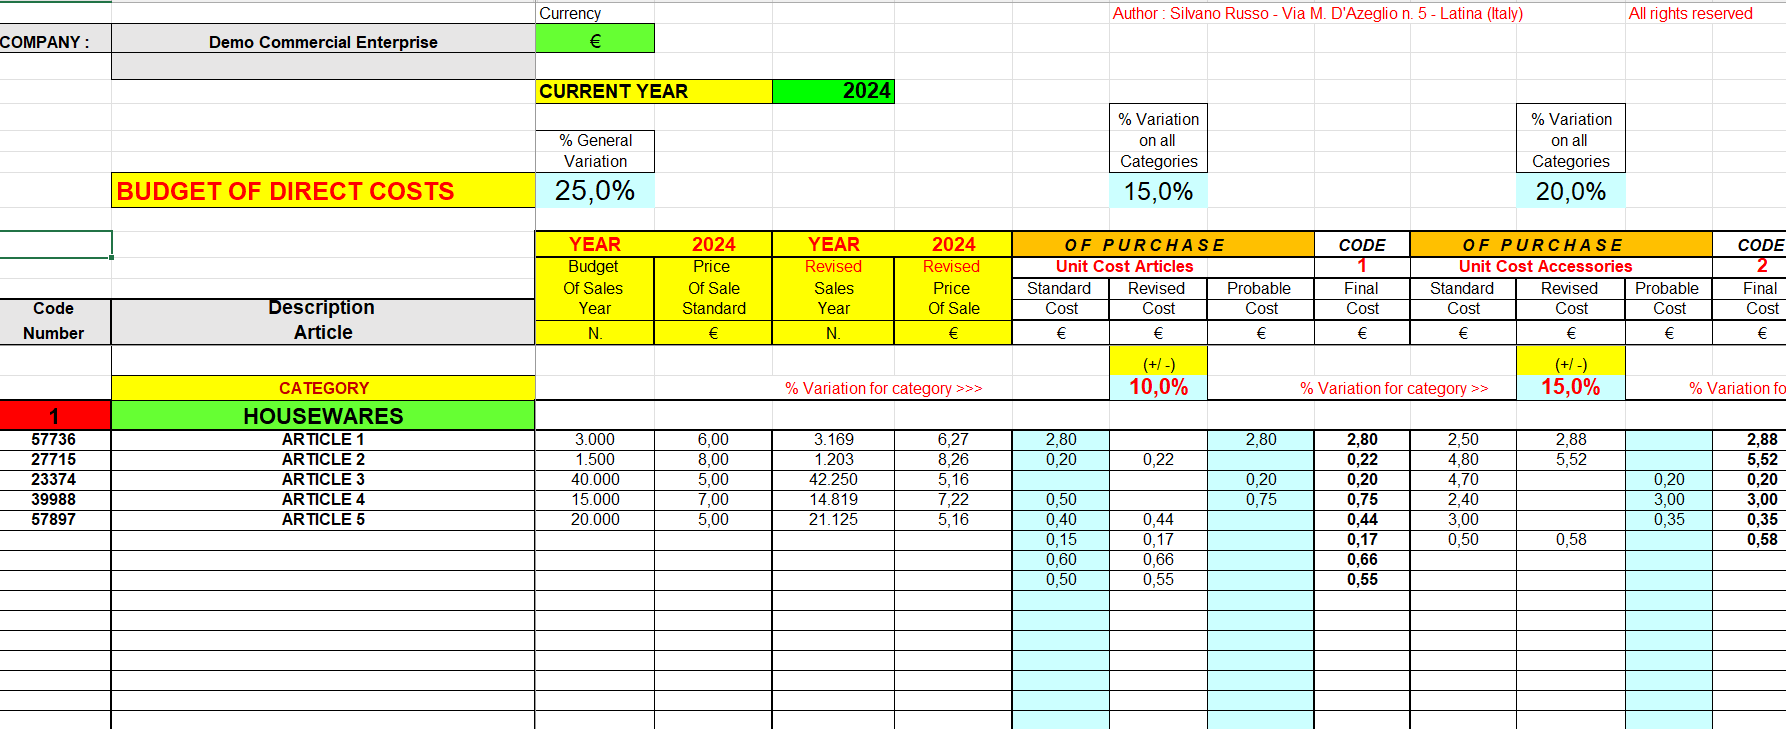
In column I it need to manually specify the unitary cost standard of all articles indicated in the budget sales. All other types of standard cost are transferred, instead, automatically from other worksheets.
For example, the unitary cost standard of the accessories comes from a base list as each article may contain multiple different accessories, a base list is the only instrument to group them and give them a value. For packaging, the standard costs come from the related base list.
The various standard costs,after being inserted, may be subject to change before become definitive. For this reason, were provided for 3 levels of variation.
If the user does want to apply none variation percentage on the standard costs entered manually or proposed by the system, it is necessary to leave empty the cell addcost standard of the first category will not want to apply none variation the user must leave empty the cell J16. In this case, ressee of the percentage change. To resume the example before, if to it’s important leave EMPTY the cell of the percentage variation.
Image no. 3 – Actual 1° Margin of Contribution
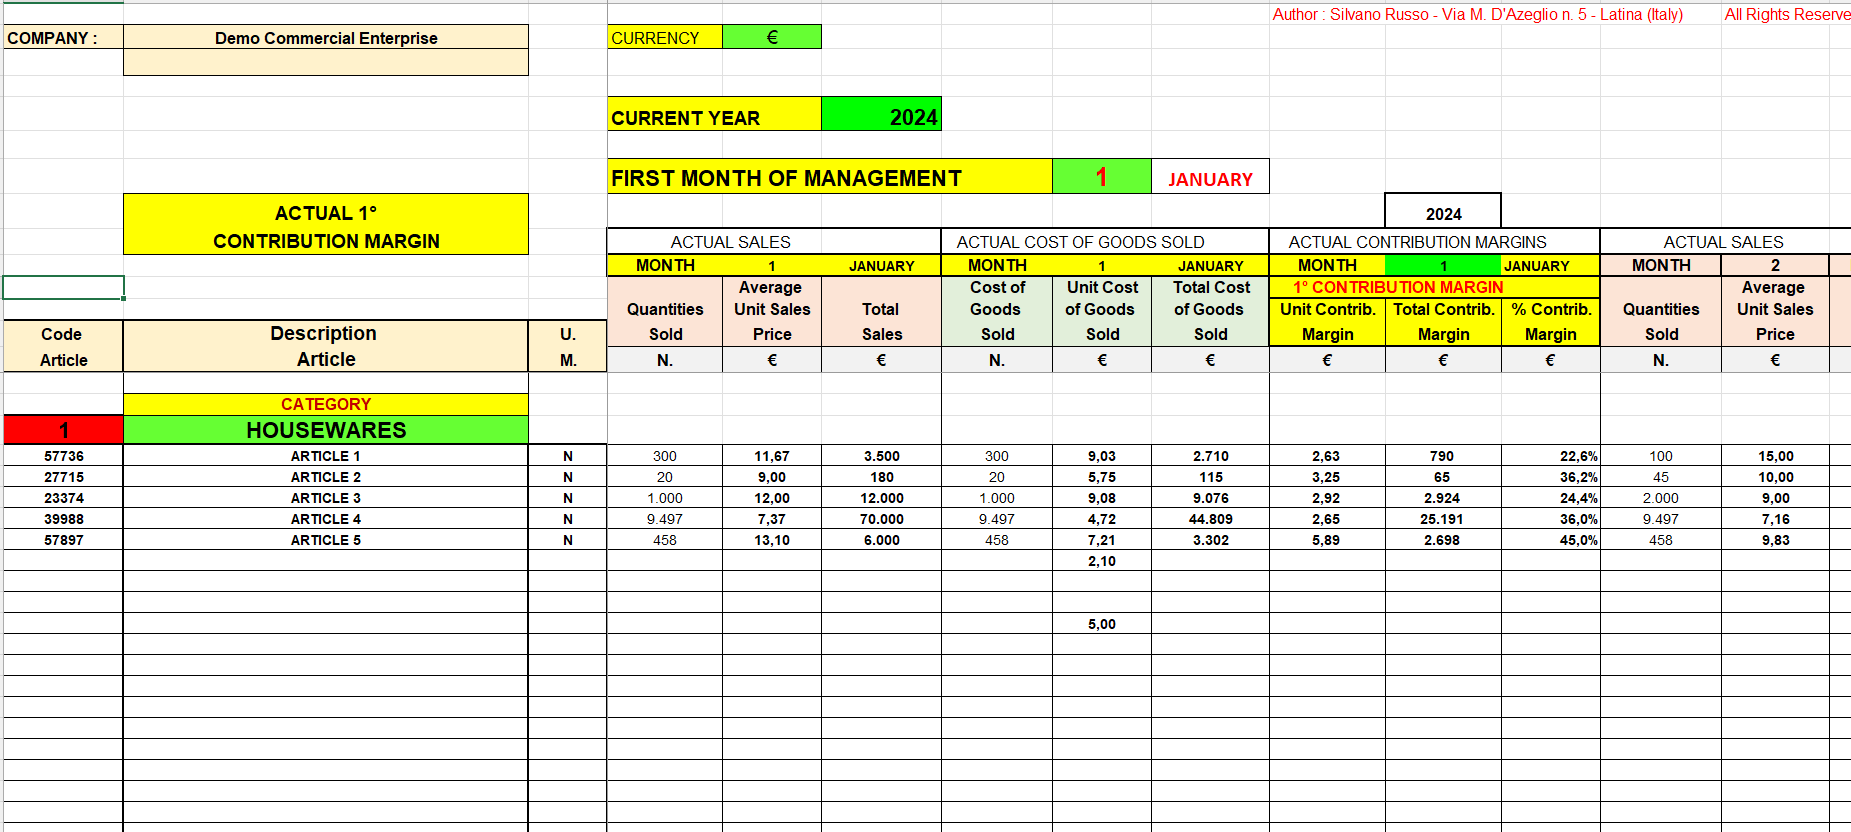
Contribution margin per article
In this worksheet are determined the contribution margins unitary and total of all articles. In practice, for each article, is highlighted the contribution margin as the difference between the actual sale price and the actual unit cost total directly attributable to the article.
In this sheet, the user does not need to enter anything since all data comes automatically from other worksheets.
In particular, data come,automatically, from the spreadsheet relating to the Actual Sales and from the worksheet relating to the Actual direct costs.
Image no. 4 -Base List of Accessories
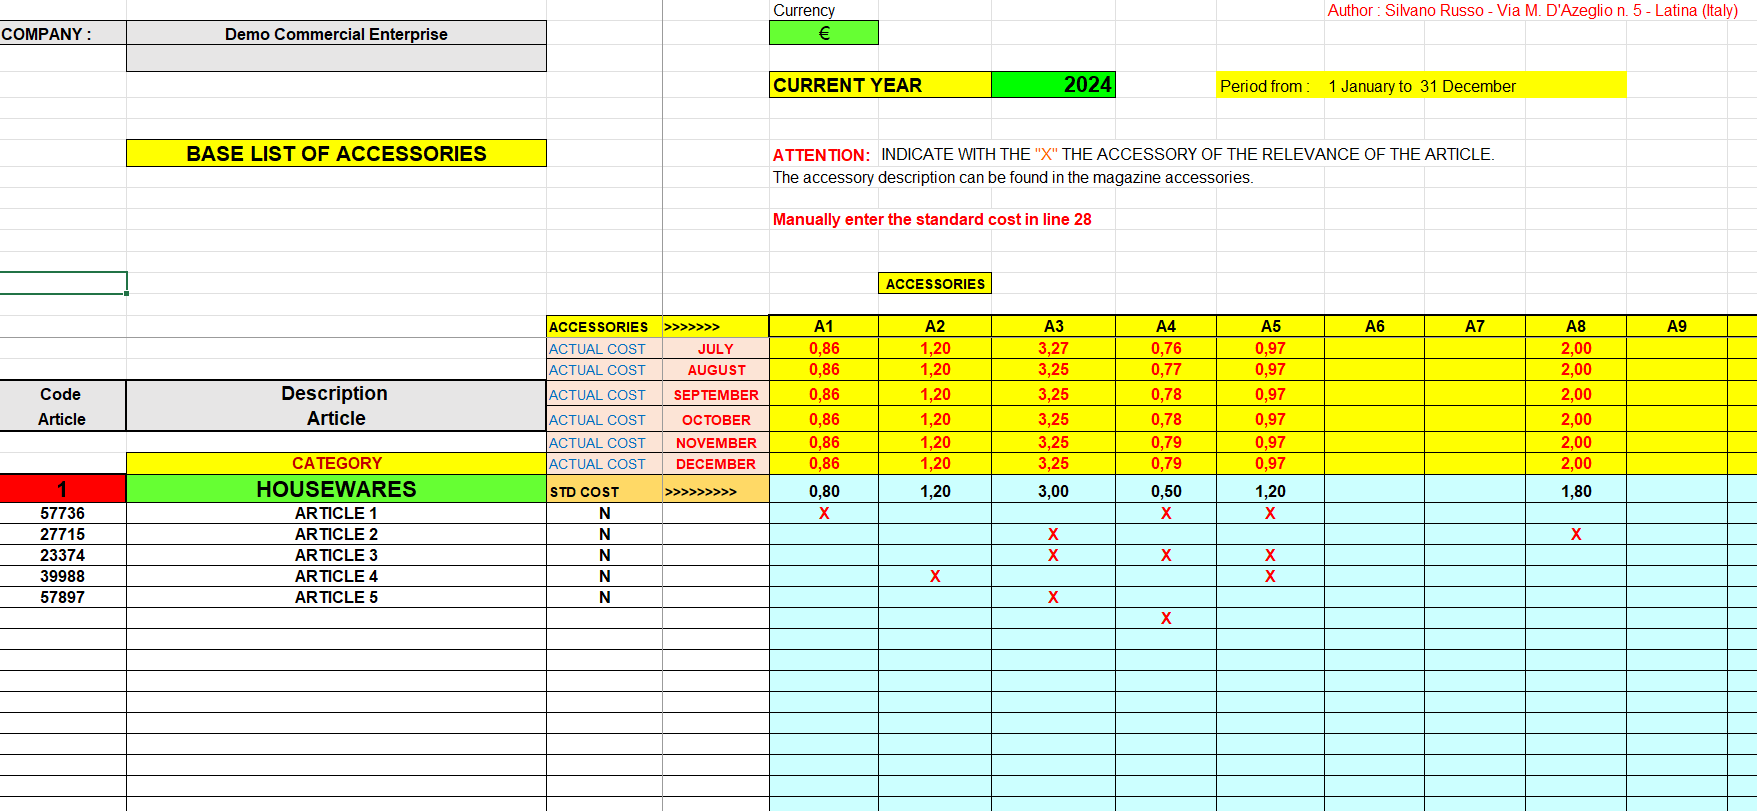
The worksheet of the Base List of accessories has been arranged to calculate both the standard cost that the actual cost of the various accessories for each article of sale.
Have been provided n. 150 accessories appointed, for simplicity, with the initials “A”. Then from A1 to A150.
The user must always indicate with an X the various accessories that make reference to each article. If is not indicated the X, is not attributed to the article none accessory and therefore no cost attributed to the accessories.
Image no. 5 – Actual Purchase Articles
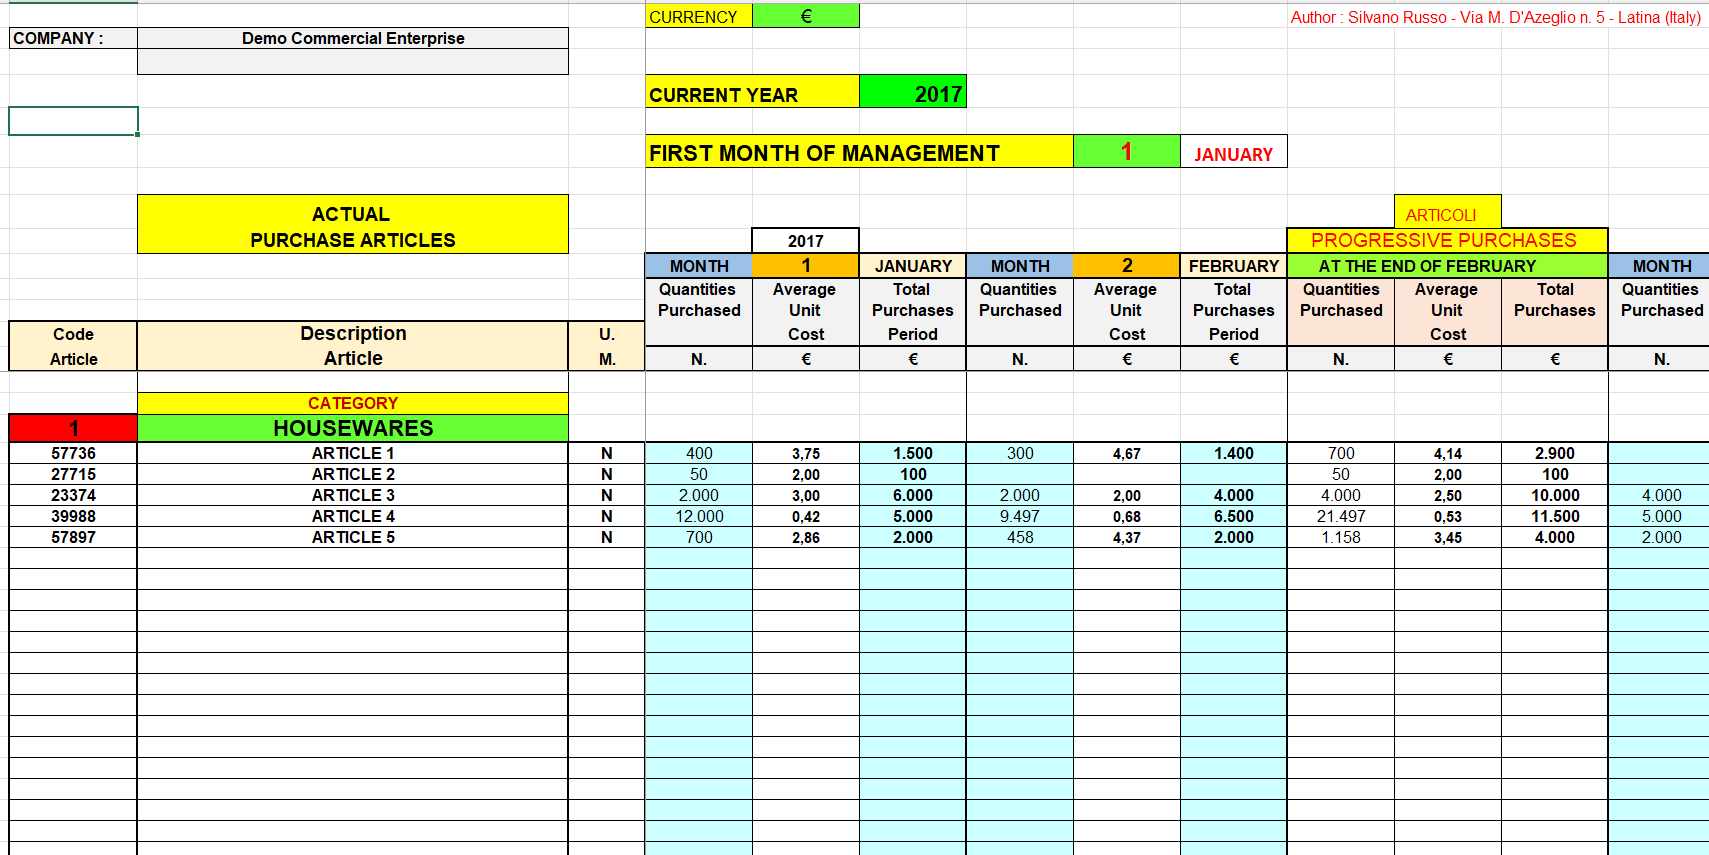
The data (quantity and total cost) of the items purchased each month must be indicated in this worksheet.
The system will automatically calculate, every month, the unit cost of each item.
If in one month they are made more purchases, the data on the quantities and the purchase costs must be summed together and inserted, in the month, in cumulative form.
Image no. 6 – Management of Warehouse Articles
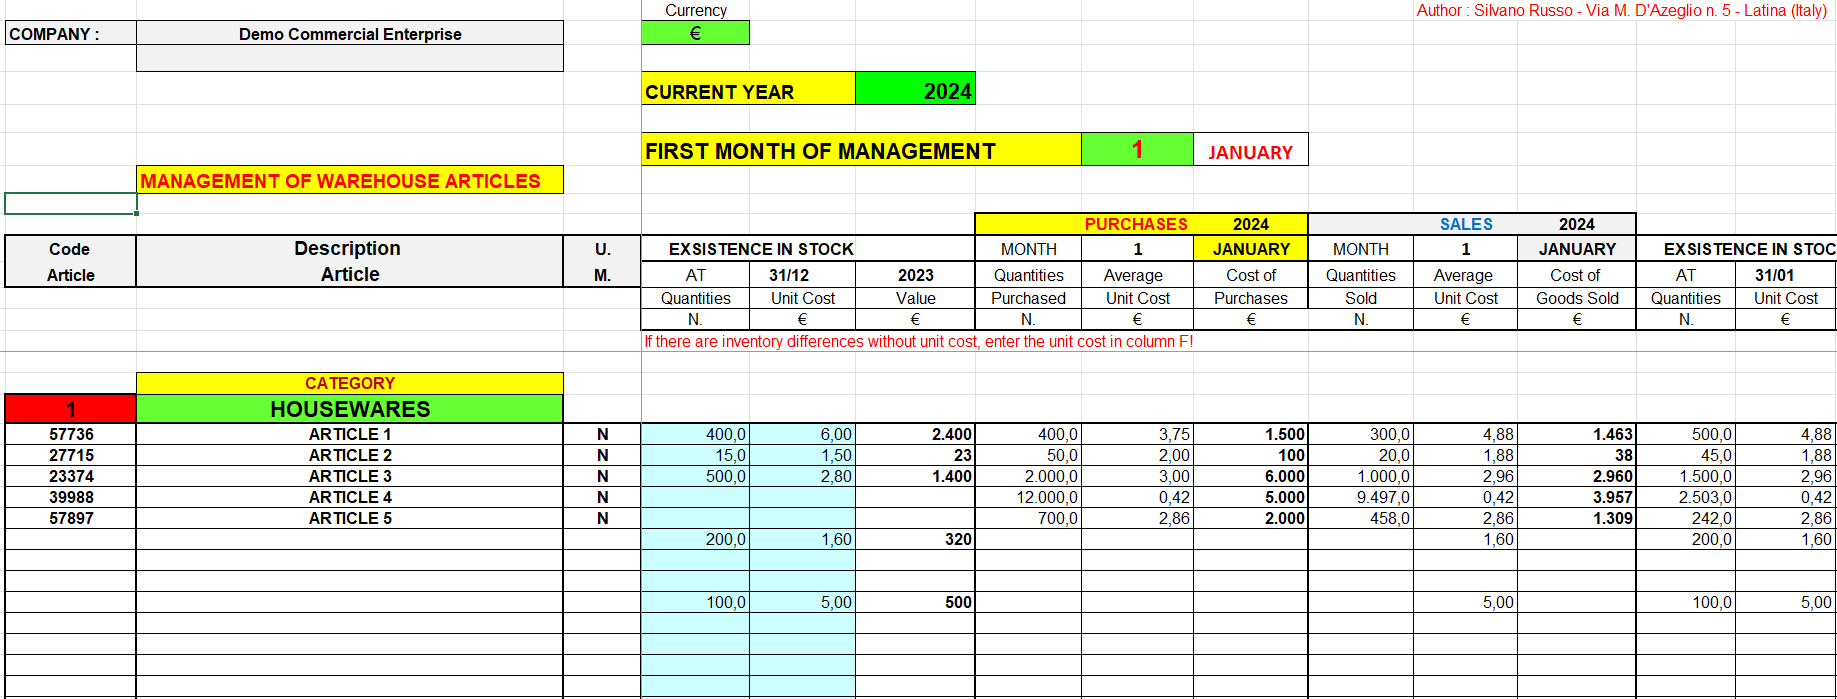
This spreadsheet is compiled with data from other worksheets. So, it’s almost completely compiled in a automatic manner.
The user must enter only the inventory data and rectify the accounting data with periodic inventories.
The inventoried quantities will then replace the accounting quantities by detecting any inventory differences they may have be positive or negative.
Image no. 7 – Final Account of Profit & Loss
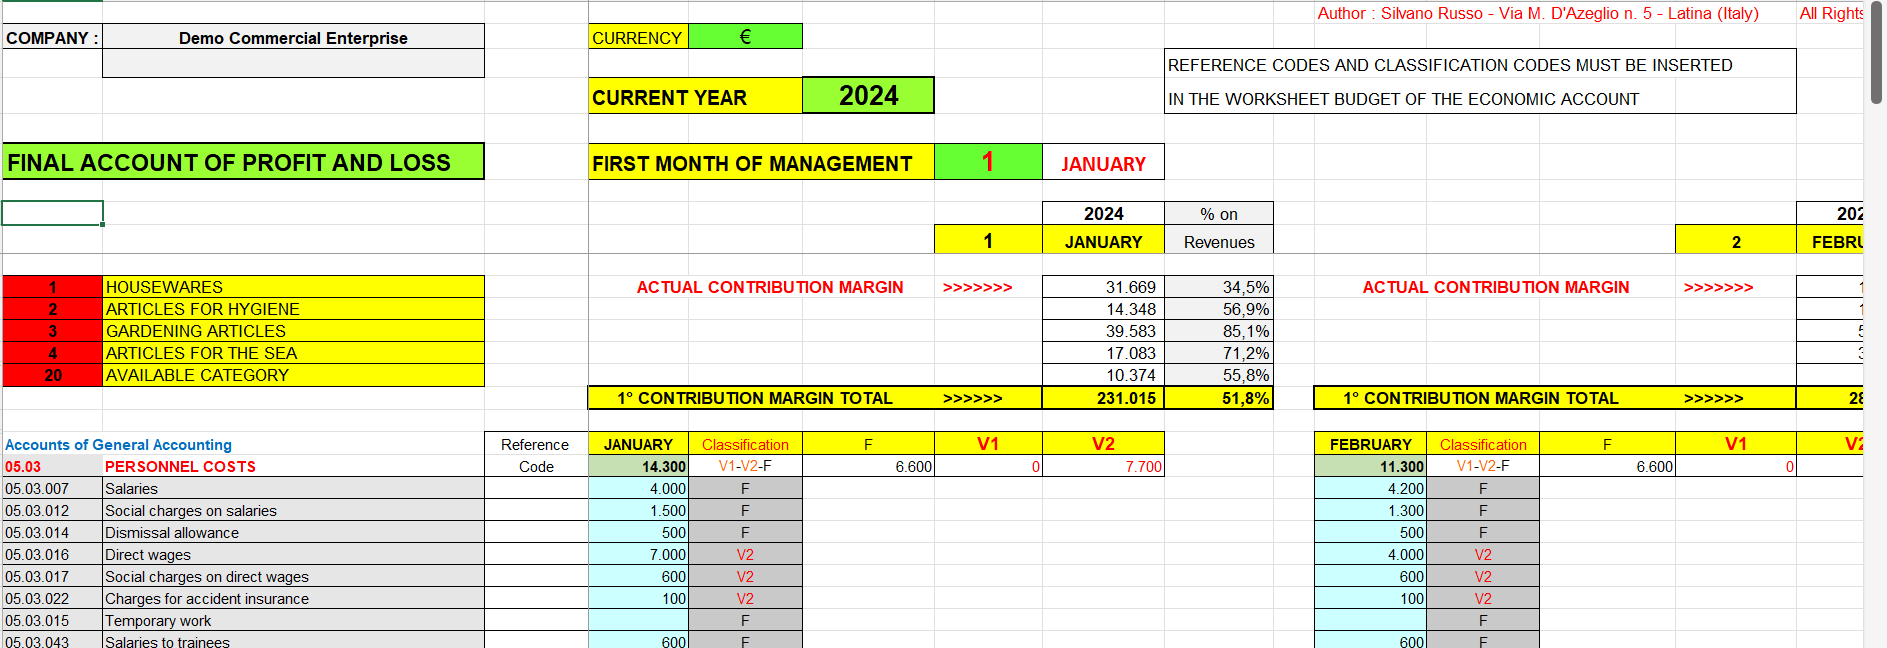
Commercial company income statement Excel
In this worksheet, you only have to enter the actual costs incurred by your company in each month.
Do not do anything else! The software will provide all the results using automated mechanisms and references.
As you can see, this software has been designed using countless automation systems to allow the user to obtain a lot of useful information from the business management by entering only very few data in the system.
Image no. 8 – Analisys of Variations
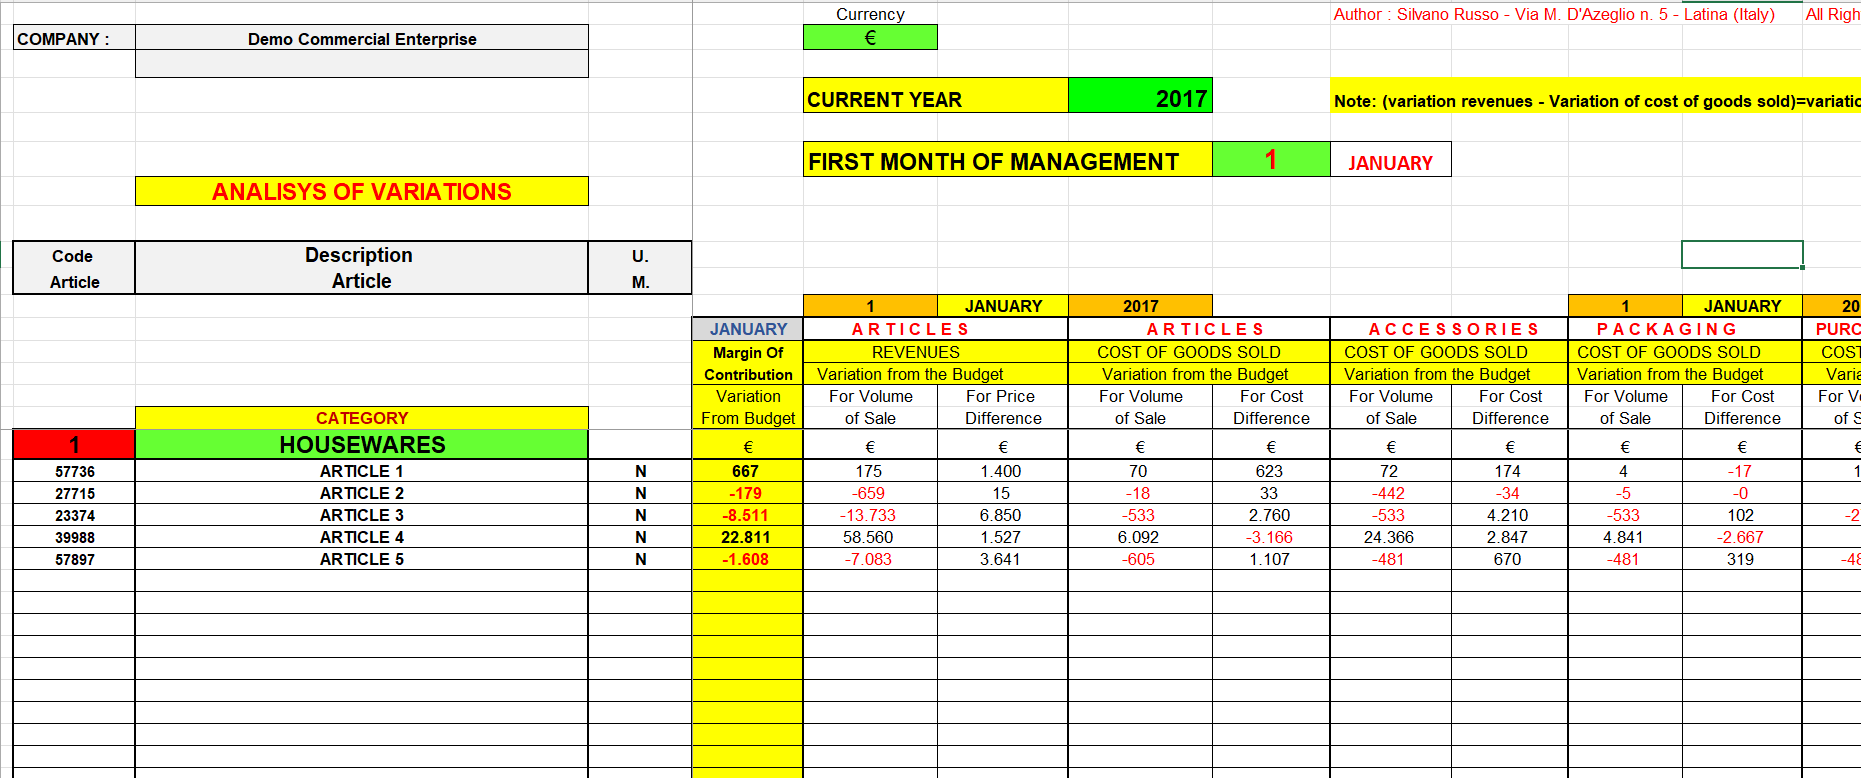
This spreadsheet compares the actual contribution margins of the period (1st M.o.C.) with those of budget.
The total change for item and for month is highlighted in the column “M.o.C. Variation from the Budget”.
The causes of the variation from the budget, indicated with the red color and the sign (-) if negative and with black color if positive, are highlighted as follows:
Sales budget variance analysis
ARTICLES – REVENUES FROM SALES
Variation from budget for sales volume
For each article highlights the change in turnover actually obtained, measured at standard prices, compared to the planned and indicated in the budget; if the variation is positive it means that, respect to the budget, higher turnover was achieved.
Variation from budget for price difference
Highlights the change in sales prices applied respect to those established in the budget. If the variation is positive it means that to the quantities sold was applied an average selling price higher than that established in the budget.
COST OF GOODS SOLD
Variation from Budget for Sales Volume
For each article highlights the change in cost, for each month, supported compared to the planned one. This variation is conditioned by the quantities sold. If the quantities of articles sold are higher than those programmed we will have a positive variation in the cost of sold the various components. If the quantities of articles sold are lower than those programmed we will have a negative variation in the cost of selling the various components.
Variation from Budget by Cost Difference
Highlights the difference between the costs incurred and the planned costs.
Image no. 9 – Prospectus of summary
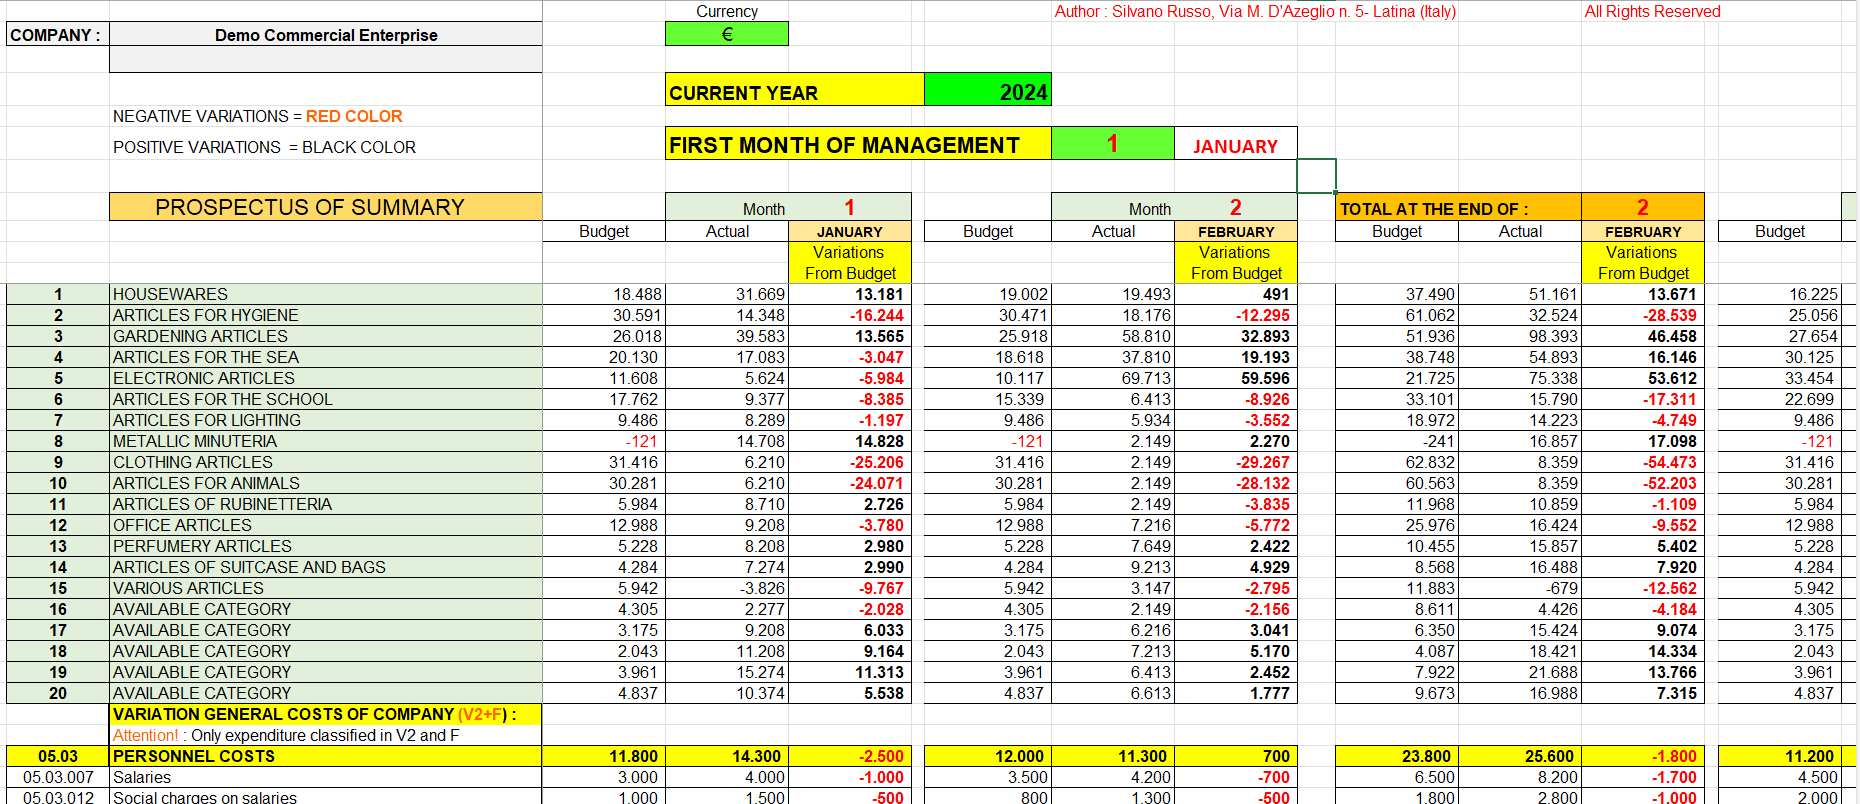
In this worksheet, the user does not have to insert anything because all the data flows into it automatically.
In row 12, for each month, are exposed the pre-tax (Ebt) results already shown in line 316 of the income statement of forecasting and of actual income statement. In the next column it’s showed the difference between the actual result (Actual Income Statement) and that expected (Income Statement of Forecasting).
Thus, it starts from the expected profit or loss and through a number of variations the actual economic result is achieved (actual profit or loss). This exposure makes us understand for what reasons was been or was not achieved the economic result forecasted in the Budget.


Reviews
There are no reviews yet.